
CHAPTER 16- THE GOVERNMENTS ROLE IN THE ECONOMY
16.1- GOVERNMENT AND THE ECONOMY
Government and the Economy:
In a capitalist economy, the market, or what people and businesses want to buy, determines the prices of goods and services. As a rule, no central planning authority such as a federal government, decides what the prices of gasoline, bread, or other products and services should be. Instead, purchases and sales between buyers and sellers throughout the country (and around the world) cause prices to move up, or down, or stay flat.
In that kind of free market, the government tries to interfere in the economy as little as possible. But government still guides the economy.
Example: the government’s role in the economy is like the conductor of an orchestra. Like a conductor the government does not actually play the economic instruments or write the music. But it interprets how the economic “notes” sound, measures the overall performance, and encourages the players in one direction or another.
The Constitutional Framework:
The U.S. government’s role in our economy begins with the Constitution. The Constitution gives several economic powers to Congress, including the powers to:
The U.S. Constitution does not guarantee Americans the right to free enterprise, and free enterprise is not entirely “free.” Government laws limit how business can operate in several ways. Business enterprises:
In addition to regulating the actions of companies, the government can also influence the economy by using its powers of taxing and spending. The government’s economic policies can influence the economy to:
Example: If the economy is slow or weak, the government may lower the amount of taxes it collects, so citizens can keep and spend more of their income. Or the government may spend more of the money it has collected (on new public projects and purchases). Either way, more money is available to stimulate economic activity.
Maintaining Economic Stability:
An economy that is running well helps the public good. As the saying goes, “Money makes the world go around.” The government, therefore, tries to steer the economy through ups and downs.
In a capitalist economy, the market, or what people and businesses want to buy, determines the prices of goods and services. As a rule, no central planning authority such as a federal government, decides what the prices of gasoline, bread, or other products and services should be. Instead, purchases and sales between buyers and sellers throughout the country (and around the world) cause prices to move up, or down, or stay flat.
In that kind of free market, the government tries to interfere in the economy as little as possible. But government still guides the economy.
Example: the government’s role in the economy is like the conductor of an orchestra. Like a conductor the government does not actually play the economic instruments or write the music. But it interprets how the economic “notes” sound, measures the overall performance, and encourages the players in one direction or another.
The Constitutional Framework:
The U.S. government’s role in our economy begins with the Constitution. The Constitution gives several economic powers to Congress, including the powers to:
- Collect Taxes
- Borrow Money
- Regulate commerce with other countries, among the states, and with Native American tribes.
- Coin money.
The U.S. Constitution does not guarantee Americans the right to free enterprise, and free enterprise is not entirely “free.” Government laws limit how business can operate in several ways. Business enterprises:
- Must pay taxes:
- Cannot compete unfairly with each other
- Cannot harm consumers with unsafe products or deceptive selling practices.
In addition to regulating the actions of companies, the government can also influence the economy by using its powers of taxing and spending. The government’s economic policies can influence the economy to:
- Grow or be more active
- Shrink to be less active
Example: If the economy is slow or weak, the government may lower the amount of taxes it collects, so citizens can keep and spend more of their income. Or the government may spend more of the money it has collected (on new public projects and purchases). Either way, more money is available to stimulate economic activity.
Maintaining Economic Stability:
An economy that is running well helps the public good. As the saying goes, “Money makes the world go around.” The government, therefore, tries to steer the economy through ups and downs.

Business Cycles:
Unfortunately, the economy is not always healthy. Business activity in the United States goes through periods of growth, or expansion, and shrinkage, or contraction. Some economist think that these ups and downs in the economy--business cycles—repeat regularly every few years. Although no two business cycles are exactly the same, economists identify four stages of economic changes:
Expansion--(Boom) or growth.
During an expansion, a period in which demand for products, services, and labor is growing is also called a boom—several conditions will occur:
- People and businesses increasingly believe that their short-term economic futures will be secure and prosperous.
- They want to buy more goods and services. They often borrow money to do so.
- The demand for goods and services grows. The first sign of a period of expansion may be a shortage in the supply, or inventory, of certain goods and services.
- The drop in inventory, in turn, makes businesses want to produce more goods and services.
- To produce more, companies hire more workers to fill the increased demand.
- Workers earn more money so they can buy more products and services.
Peak (Inflation) or the highest point of growth.
An expansion cannot continue forever. Eventually, the new demand for goods and services is met, and expansion hits its peak, or highest level.
- Demand for new investments to keep businesses and lifestyles growing increases, so people and businesses see to borrow money.
- Demand for money causes interest rates—the cost of borrowing money—to go up.
- Businesses cannot find enough workers to hire, so they raise salaries to attract workers. These higher expenses reduce company profits or cause companies to raise their prices.
- If rates and prices get too high, companies stop borrowing money to make new investments.
Recession/ Depression
What goes up must come down. The natural movement of the cycle continues.
- As fewer businesses make fewer new investments, companies stop hiring new workers. Some current workers may lose their jobs if the company loses business.
- Workers are laid off. New workers hired earn lower salaries. Wages overall stay flat or go down.
- With more people out of work the demand for products and services declines.
- As people have less to spend, companies lower prices to continue to sell their products.
- Momentum gathers again, but this time it moves downward.
When the United States economy has experienced lower demand, low production, and rising unemployment, resulting in decline or no growth for six months, economists say that the economy is in a recession. Often, economic growth can resume at this point.
- As demand for new investments and purchases drops, interest rates and prices begin to fall.
- The lower rates and prices stimulate new investments and spending.
- Eventually, the economy begins to expand again, and a new business cycle starts.
A serious recession that lasts significantly longer than six months is called a depression. In economic terms, a depression can be seen as a very severe recession, and even after a depression which is characterized by so much human suffering, the business cycle of expansion and contraction will resume.
Recovery—A period of innovation
Behind every cloud is a silver lining. Some of America’s greatest inventions and ideas have developed during times of recession or depression. It is the implementation of these ideas and the production of new inventions that turns the economy in a positive direction.
- New inventions are produced or products that already exist are improved.
- Existing companies or newly created businesses require workers to produce these new goods.
- People buy new products creating revenue.
- Competing businesses improve their existing products to compete with the new and innovative ideas.
Managing How the Economy Performs:
Economists believe that the business cycle is a natural process, cause by billions of people and businesses around the world buying and selling what they need. But the governments try to influence the natural fluctuations of the economy in order to:
- Protect their citizens and businesses in the short term, or near future.
- Encourage the economy to grow steadily, but not too quickly, over the longer term.
Measuring Economic Performance:
During a medical check-up, your doctor gathers information about how healthy you are: your pulse, your blood pressure, your reflexes, and other signals. Before the government can even try to guide the economy, economists must gather information about the economy’s health, called economic indicators.
These include:
- Gross Domestic Product (GDP)--the value of all goods and services produced in a country for one year. The 2001 GDP of the United States was more than $10 trillion. Economists use the GDP to measure the size and growth of a country’s economy from year to year.
- Consumer Price Index (CPI)--list of the prices of approximately 400 selected ordinary goods and services used by consumers, such as milk, jeans, cable TV, haircuts, pet care, and phone service. Government economists watch for (and report) monthly changes in the index to see if prices are going up or down.
- Inflation—in increase in the overall level of prices for goods and services. Economists consider high inflation as sign of an unhealthy economy.
- Deflation—the opposite of inflation, is a period in which the value of assets and price levels decrease.
- Unemployment Rate--the number of people looking for work divided by the number of people in the civilian (non-military) workforce. Economists consider high unemployment a sign of a weak economy.
Adjusting Economic Performance:
A doctor an use medical tools, including drugs, surgery, and advice about exercise to improve your health. The Government uses several tools to improve the health of the economy. The two most important are:
1- Fiscal Policy:
This is the government's plan for how much ti collects and spends. To put more money back into a weak or sluggish economy, the government may decide to hire more workers, to give raises to its employees, to start new building projects, or to reduce taxes, leaving citizens with more of their own money to spend.
2- Monetary Policy:
This is the government's plan for how much money or credit it makes available. Lowering federal bank lending rates makes it easier for more people and companies to borrow and lend money.
Managing the Federal Budget:
You, your friends, and your family are consumers. The Federal government is a huge consumer that buys a lot of goods and services. What the government buys and how much money it spends have an enormous influence on the economy.
At the beginning of each year, the president submits a federal budget to Congress for approval. Creating the federal budget to Congress for approval. Creating the federal budget is one of the powers that the office of the president uses to shape legislation for congress to pass. In the proposed budget the president outlines:
- How much money government agencies need to spend on existing programs.
- Ideas for spending on new programs that the president proposes.
- Estimates of how much money the government will collect in taxes and other revenues.
Congress must approve the budget a lengthy process of negotiations and compromises.
Balancing the Budget:
The money the government can spend comes mainly from two sources:
- Taxes- or Revenues
- Loans or Borrowing
When the federal budget is balanced the government does not spend more money than it receives in taxes. But the federal government often decides to spend more than it earns resulting in a budget deficit--more spending than income. The government plans to borrow money to make up the difference. Some government leaders have tried to pass laws to stop Congress from approving deficit budgets, but, so far these attempts have been ruled unconstitutional.
National Debt:
Since around 1940, federal spending has grown enormously, largely on military and social expenses. Government income has not grown as quickly, so the national debt-- the amount of money the country owes--is now in the trillion of dollars!
The economic boom of the 1990s combined with efforts to cut spending, reduced the federal deficit. Before 2002, there were four consecutive federal budget surpluses-- more income than spending. Some of this money was used to reduce the national debt. However after the events of September 11, 2001, the economic downturn, and the Affordable Health Care Act, government spending increased and has again exceeded income.
16.2- THE FEDERAL GOVERNMENT'S BUDGET PROCESS
Congress must create and pass numerous funding bills each fiscal year to keep the federal government open. This infographic explains the process.


How the Federal Government Creates and Manages Its Budget
Every year, Congress begins work on a federal budget for the next fiscal year. The federal government’s fiscal year runs from October 1 of one calendar year through September 30 of the next.
The work actually begins in the executive branch the year before the budget is to go into effect.
Annual Funding AreasThe annual budget covers three spending areas:
Authorization
For agencies and their programs to be funded, Congressional authorization committees must pass, and the president must sign, authorization bills giving agencies the legal authority to fund and operate their programs. Normally, without authorization, an agency or program cannot receive annual appropriated funding.
Authorization is not tied to the same schedule as the budget appropriations process; programs can be authorized at any time of year on an annual, multi-year, or permanent basis.
Budget Resolutions
Congress’s first task in the annual process is to pass a budget resolution creating a framework and setting overall spending limits. As with most things Congress does, its two chambers—the Senate and the House of Representatives—each draft their own budget resolution. The two plans are merged, and each chamber votes on the identical resolution.
Appropriations Bills
The appropriations committee for each chamber divides the amount allotted for federal agency funding between 12 subcommittees. Each subcommittee is in charge of funding for different functions of government, such as defense spending, energy and water, and interior and environment, and for the agencies involved.
The subcommittees conduct hearings with agency leaders about their budget requests and draft appropriations bills setting the funding for each. The full House and Senate vote on their bills, merge both versions of each one, and vote on the identical version of every bill. Each one, if passed, goes to the president for signature.
Budget Completion or Government Shutdown
If Congress passes, and the president signs, all 12 bills by September 30—the last day of the current fiscal year—the country has a new budget in time for the start of the next fiscal year. If Congress can’t agree on 12 separate bills, it can pass an Omnibus bill with funding for multiple areas. If the budget is not completed by the new fiscal year, Congress must pass a continuing resolution authorizing temporary funding at the previous year’s levels or face a government shutdown.
In the event of a shutdown, the government stops issuing passports, closes national parks and monuments, halts NASA operations, and puts many other functions on hold.
When the budget process is finally complete or Congress passes a continuing resolution, the government resumes normal operations.
Federal Budget by Fiscal YearTo see the approved federal budget for a year, you must look at the appropriations bills for that year that were signed into law.
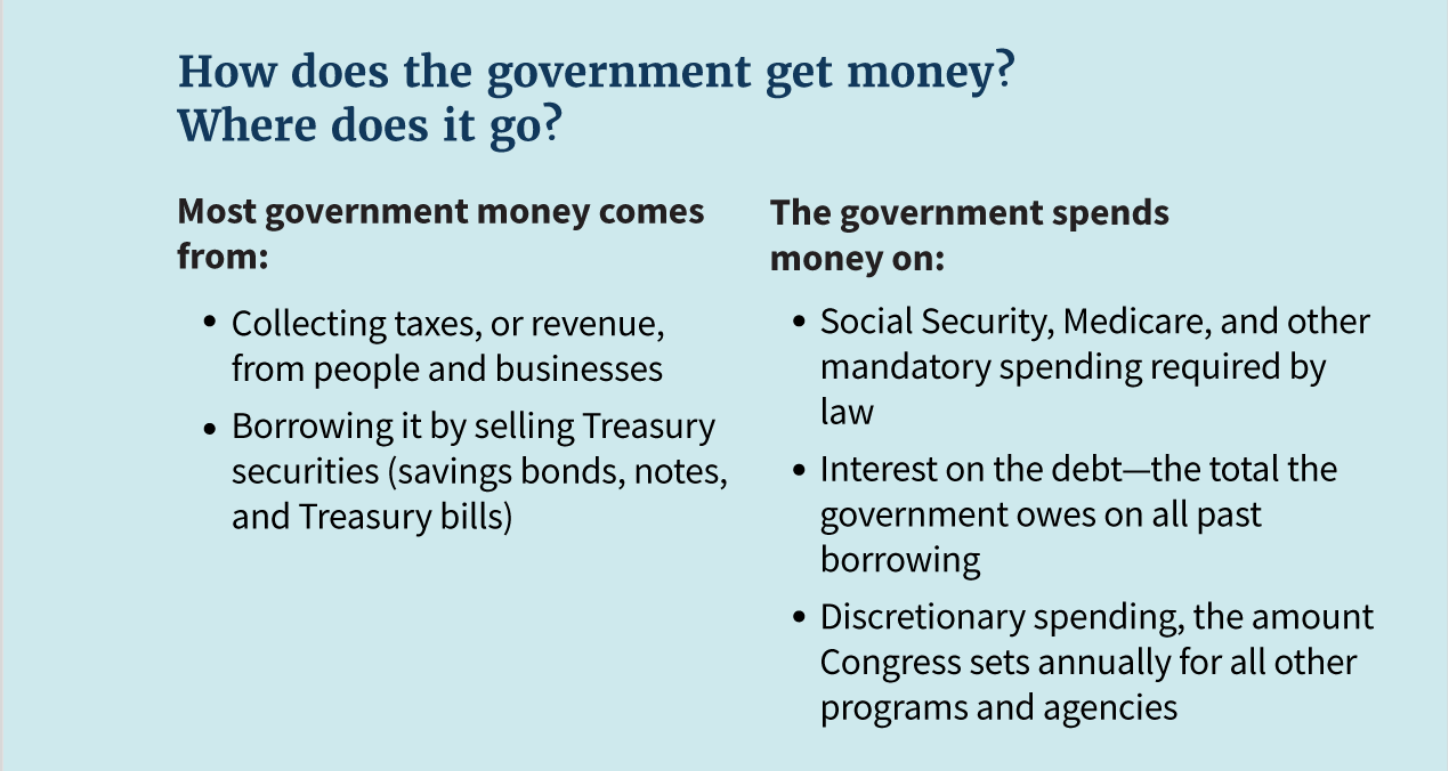
The deficit is financed by the sale of Treasury securities (bonds, notes, and bills), which the government pays back with interest. Part of what the government spends money on each year is the interest owed on all years’ deficits combined, or the national debt.
The debt ceiling is the maximum amount of debt the government allows itself to hold. Congress can vote to raise the debt ceiling. If it doesn’t and the debt hits the ceiling, the government won’t be able to borrow any more money and it won’t be able to pay its bills.
Every year, Congress begins work on a federal budget for the next fiscal year. The federal government’s fiscal year runs from October 1 of one calendar year through September 30 of the next.
The work actually begins in the executive branch the year before the budget is to go into effect.
- Federal agencies create budget requests and submit them to the White House Office of Management and Budget (OMB).
- OMB refers to the agency requests as it develops the president’s budget proposal.
Annual Funding AreasThe annual budget covers three spending areas:
- Federal agency funding, called discretionary spending—the area Congress sets annually. Discretionary spending typically accounts for around a third of all funding.
- Interest on the debt, which usually uses less than 10 percent of all funding
- Funding for Social Security, Medicare, veterans benefits, and other spending required by law. This is called mandatory spending and typically uses over half of all funding.
Authorization
For agencies and their programs to be funded, Congressional authorization committees must pass, and the president must sign, authorization bills giving agencies the legal authority to fund and operate their programs. Normally, without authorization, an agency or program cannot receive annual appropriated funding.
Authorization is not tied to the same schedule as the budget appropriations process; programs can be authorized at any time of year on an annual, multi-year, or permanent basis.
Budget Resolutions
Congress’s first task in the annual process is to pass a budget resolution creating a framework and setting overall spending limits. As with most things Congress does, its two chambers—the Senate and the House of Representatives—each draft their own budget resolution. The two plans are merged, and each chamber votes on the identical resolution.
Appropriations Bills
The appropriations committee for each chamber divides the amount allotted for federal agency funding between 12 subcommittees. Each subcommittee is in charge of funding for different functions of government, such as defense spending, energy and water, and interior and environment, and for the agencies involved.
The subcommittees conduct hearings with agency leaders about their budget requests and draft appropriations bills setting the funding for each. The full House and Senate vote on their bills, merge both versions of each one, and vote on the identical version of every bill. Each one, if passed, goes to the president for signature.
Budget Completion or Government Shutdown
If Congress passes, and the president signs, all 12 bills by September 30—the last day of the current fiscal year—the country has a new budget in time for the start of the next fiscal year. If Congress can’t agree on 12 separate bills, it can pass an Omnibus bill with funding for multiple areas. If the budget is not completed by the new fiscal year, Congress must pass a continuing resolution authorizing temporary funding at the previous year’s levels or face a government shutdown.
In the event of a shutdown, the government stops issuing passports, closes national parks and monuments, halts NASA operations, and puts many other functions on hold.
When the budget process is finally complete or Congress passes a continuing resolution, the government resumes normal operations.
Federal Budget by Fiscal YearTo see the approved federal budget for a year, you must look at the appropriations bills for that year that were signed into law.
- Go to the Appropriations and Budget page on Congress.gov.
- Click the year you want to see.
- A chart will open. Scroll down to find various versions of budget legislation in it. To identify which budget legislation in the chart actually became law, look in the chart under the far right column titled "Public Law" for a Pub.L. number that was assigned to the legislation when it passed.
The deficit is financed by the sale of Treasury securities (bonds, notes, and bills), which the government pays back with interest. Part of what the government spends money on each year is the interest owed on all years’ deficits combined, or the national debt.
The debt ceiling is the maximum amount of debt the government allows itself to hold. Congress can vote to raise the debt ceiling. If it doesn’t and the debt hits the ceiling, the government won’t be able to borrow any more money and it won’t be able to pay its bills.
16.2- THE FEDERAL RESERVE
Understanding the FED (Federal Reserve)
Besides taxing and spending, the Federal Government also affects the economy by influencing the supply of money and the cost of borrowing money.
Federal Reserve System:
Established by Congress in 1913, the Federal Reserve System, usually simply called the Fed, works as the central banking system of the United States. The 25 Federal Reserve Bank branches located in 12 Reserve Districts across the country serve:
Federal Reserve Banks deposit money from and lend money to other banks. They are banks for other banks.
People keep their money in Commercial Banks- Those banks keep their money in a Federal Reserve Bank and borrow money from the Fed.
Federal Reserve's Duties:
The Federal reserve has four main duties:
1- Carry out the Federal Government's Monetary Policy:
This is done by controlling:
2- Make and enforce rules for banking institutions
3- Keep the banking system stable
4- Serve the U.S. Government, the Public, Financial Intuitions, and Foreign Official Intuitions in financial matters.
Controlling the Money Supply:
The Fed can control the money supply and therefore influence the economy in three ways:
1- Changing the Reserve Requirement
The Formula for determining the amount of cash that member banks must keep on deposit in their regional Federal Reserve bank. This reserve requirement ensures that member banks are financially sound and safe for consumers to use.
The interest rate that member banks must pay to borrow money from a Federal Reserve Bank.
3- Buying and Selling Government Securities
Instruments of government debt, such as US Treasury notes and bonds that are sold to raise money for the federal government.
Political Independence:
The Federal Reserve System is run by a a board of seven governors who are appointed by the US President and approved by the Senate. Every governor is appointed for 14 years and they are separated by a two year cycle.
The President also appoints one of them to be the chair for a 4-year term, whenever the previous chair's term ends. Ideally, the chair and the governors make decisions in the public interest without interference by the President, Congress, or Political Parties. (Similar to the Supreme Court)
Besides taxing and spending, the Federal Government also affects the economy by influencing the supply of money and the cost of borrowing money.
Federal Reserve System:
Established by Congress in 1913, the Federal Reserve System, usually simply called the Fed, works as the central banking system of the United States. The 25 Federal Reserve Bank branches located in 12 Reserve Districts across the country serve:
- The federal government
- Other banks and banking institutions
Federal Reserve Banks deposit money from and lend money to other banks. They are banks for other banks.
People keep their money in Commercial Banks- Those banks keep their money in a Federal Reserve Bank and borrow money from the Fed.
Federal Reserve's Duties:
The Federal reserve has four main duties:
1- Carry out the Federal Government's Monetary Policy:
This is done by controlling:
- The interest rates that other banks must pay to borrow money from the Fed.
2- Make and enforce rules for banking institutions
- These rules protect consumer's credit rights.
3- Keep the banking system stable
- They do this by watching over how banks operate.
4- Serve the U.S. Government, the Public, Financial Intuitions, and Foreign Official Intuitions in financial matters.
Controlling the Money Supply:
The Fed can control the money supply and therefore influence the economy in three ways:
1- Changing the Reserve Requirement
The Formula for determining the amount of cash that member banks must keep on deposit in their regional Federal Reserve bank. This reserve requirement ensures that member banks are financially sound and safe for consumers to use.
- If the reserve requirement is raised, banks have less money available to lend to individuals and corporations.
The interest rate that member banks must pay to borrow money from a Federal Reserve Bank.
- If the Fed lowers its rate, member banks are more likely to borrow from the Fed, and then lend money to customers. Loans to customers support new investments that can make the economy grow. In 1993, when the Fed lowered its interest rates, economists credited it with pulling the economy out of the recession.
3- Buying and Selling Government Securities
Instruments of government debt, such as US Treasury notes and bonds that are sold to raise money for the federal government.
- when it buys back securities the Fed spends and puts more money into circulation. When it sells securities it takes money out of circulation, leaving less money for others to borrow.
Political Independence:
The Federal Reserve System is run by a a board of seven governors who are appointed by the US President and approved by the Senate. Every governor is appointed for 14 years and they are separated by a two year cycle.
The President also appoints one of them to be the chair for a 4-year term, whenever the previous chair's term ends. Ideally, the chair and the governors make decisions in the public interest without interference by the President, Congress, or Political Parties. (Similar to the Supreme Court)
16.3- Gdp AND INDICATORS OF ECONOMIC HEALTH
Types of Economic Indicators
There are three types of economic indicators: leading, lagging and coincident.
Leading indicators point to future changes in the economy. They are extremely useful for short-term predictions of economic developments because they usually change before the economy changes.
Lagging indicators usually come after the economy changes. They are generally most helpful when used to confirm specific patterns. You can make economic predictions based on the patterns, but lagging indicators cannot be used to directly predict economic change.
Coincident indicators provide valuable information about the current state of the economy within a particular area because they happen at the same time as the changes they signal.
Top Economic Indicators and How They’re Used
There are several economic indicators that are grouped into the three types listed above. Each one can help investors, economists and financial analysts make smart financial decisions.
Gross Domestic Product (GDP)
GDP is a lagging indicator. It is one of the first indicators used to gauge the health of an economy. It represents economic production and growth, or the size of the economy. Measuring GDP can be complicated, but there are two basic ways to measure it.
One measurement is the income approach. This approach adds up what everyone earned in a year, including gross profits for non-incorporated and incorporated firms, taxes less any subsidies and total compensation to employees. The other approach is the expenditure method. This method adds up what everyone spent in a year, including total consumption, government spending, net exports and investments. The results of these two measurements should be roughly the same. However, the expenditure method is the more common approach because it includes consumer spending, which is accounts for majority of a country’s GDP.
GDP is usually expressed in comparison to the previous quarter or year. For example, if the GDP of a country is up 2% in 2018, the economy of that country has grown 2% since the previous measurement of GDP in 2017. Annual GDP figures are often considered the best indicators for the size of the economy. Economists use two different types of GDP when measuring a country’s economy. Real GDP is adjusted for inflation, while nominal GDP is not adjusted for inflation.
An increase in GDP indicates that businesses are making more money. It also suggests an increase in the standard of living for people in that country. If GDP decreases, then it suggests the reverse.
The market’s responses to GDP shifts may also depend upon how one quarterly GDP measure compares to prior quarters, as well as how it compares to economists’ expectations for that current quarter.
The Stock Market
The stock market is a leading indicator. It’s also the indicator that most people look to first, even though it’s not the most important indicator.
Stock prices are partially based on what companies are expected to earn. If companies’ earnings estimates are accurate, the stock market can indicate the economy’s direction. For example, a down market could indicate that overall company earnings are expected to decrease and the economy could be headed toward a recession. On the other hand, an up market could suggest that earnings estimates are up and therefore the economy as a whole may be thriving.
The stock market is not necessarily an accurate leading indicator. Earning estimates could be wrong, and the stock market is vulnerable to manipulation. Wall Street corporations and traders can manipulate numbers to inflate stocks via complex financial derivative strategies, high-volume trades and creative accounting principles. (Wall Street’s version of creative accounting is not always legal.) In addition, the government and Federal Reserve have used federal stimulus money and other strategies to keep markets high in order to avoid public panic in the event of an economic crisis. Since the market is vulnerable to manipulation, a stock or index price is not necessarily an accurate reflection of its value.
There are also stock market bubbles, which can give a false positive for the economy’s direction. If investors ignore underlying economic indicators, and there are unsupported increases in price levels, a market crash could happen. We saw this when the market crashed in 2008 as a result of overvalued credit default swaps and subprime loans.
Unemployment
Unemployment is a lagging indicator. The Bureau of Labor Statistics releases a monthly estimate of the cumulative number of jobs lost or created in the previous month, as well as a percentage figure that represents how many Americans are unemployed and actively looking for work.
This unemployment rate is determined through a monthly survey of 60,000 households. It estimates the proportion of Americans who were unemployed during the period when the survey was taken. The unemployment rate only reflects people who are unemployed and looking for work.
The non-farm payrolls represent the total number of workers employed by U.S. businesses, other than general government employees, workers in private households, employees of non-profit organizations that provide assistance to individuals and farm workers.
The number of jobs created or lost in a month is an indicator of economic health and can significantly impact the securities markets. When more businesses are hiring, it suggests that businesses are performing well. More hiring can also lead to predictions that more people will have more money to spend, since more of them are employed.
If unemployment rates rise unexpectedly, or decline less than expected, that can sometimes be associated with a drop in stock prices as it may suggest that employers cannot afford to hire as many people. Remember, how an economic indicator comes in relative to expectations is very important.
Consumer Price Index (CPI)
CPI is a lagging indicator, and the U.S. relies on it heavily as one of the best indicators of inflation. This is because changes in inflation can spur the Federal Reserve to make changes to its monetary policy.
CPI measures changes in prices paid for goods and services by urban consumers for a specified month. It’s essentially a measure of the cost of living changes. It offers a gauge of inflation as it relates to purchasing those goods and services.
CPI takes a sampling of several hundred goods and services across 200 categories. The Bureau of Labor Statistics collects this data through both phone calls and personal visits in 87 urban areas across the U.S. CPI does not include Social Security taxes, income, or investments in stocks, bonds or life insurance. However, it does include all sales taxes associated with the purchase of those goods.
Producer Price Index (PPI)
PPI is a coincident indicator that tracks price changes in almost all goods-producing sectors, including mining, manufacturing, agriculture, forestry and fishing. PPI also tracks price changes for an increasing portion of the non-goods-producing sectors of the economy. The report measures prices for finished goods, intermediate goods and crude goods. Prices from thousands of establishments are tracked each month and are recorded on the U.S. Bureau of Labor Statistics website.
PPI is important because it’s the first inflation measure available in the month. It captures price movements on a wholesale level, before price changes show up on the retail level.
